
Big Data
High School Art: 10th - 12th grades, and any interdisciplinary subject related to data
By Ron Wigglesworth, BEd, MEd, FAC
PhD Graduate Studies in Art Education,
University of Alberta, Canada

Big Idea – Make sense of abstract Big Data numbers by creating concrete, static or kinetic images/visualities which communicate or translate the meaning of the numbers to a human scale of understanding. The subject of the visualities should be created in each student’s artist voice, with the freedom and empowerment to express their own social, economic, political and ecological concerns so his/her work has personal meaning and strength of concern. Employ art hand skills in 21st century postmodern art by using Big Data to illustrate interdisciplinary social justice concerns in visualities, created to move a viewer to action.
This is a complex idea. I suggest beginning with a ‘bridge in’ of the Book Transformation project for students to experience creating an object which communicates their own social justice concerns and experienceing using their artistic voice to do so. The skills and voice may then be built upon for the complex problem of creating Big Data Visualities.
School class or context – High School Art 10, 11, 12 and any interdisciplinary subject related to the data.
To understand how to incorporate 21st century skills and the digital screen into art making, my undergraduate preservice art education students were challenged to adopt the role of a high school student asked to express social commentary and move the viewer by doing two projects. This project series has potential for any level of art student – the teacher can determine the most appropriate curricular application.
DOWNLOAD A PDF OF THIS LESSON HERE:
Big Data by Ron Wigglesworth .pdf
DOWNLOAD "BIG DATA" SLIDESHOW HERE:
Note that because of Digication's 20MB file size limit, this slideshow has been broken into six downloadable parts. You can combine them on your own computer.
Project Part 1 – Transformed Books
Taking a concrete object and making it represent an abstract idea
- Taking a physical object and turning it into another physical object infused with new phenomenological and personal meaning
- Reusing the book to make a social justice observation
Reimagined from one medium to multi-media; from old (physical book) to new (art); from collection of objective information (encyclopaedia facts) to subjective meaning (where the artist includes personal experience and makes value judgments) as expressed through art.
The students find their own artist voice by reimagining, repurposing and transforming books to create multi-media art which addresses the students’ lived experiences and make social, political or ecological comment or shifts of ideas.
- Rift between printed and digital texts – encyclopedias are yesterday’s Google.
- Breathe new life into old discarded encyclopaedias.
- Transform the books with their own interpretation and cautions.
- Some students resisted changing or damaging the book and left it readable.
- Creative telling of the artists’ personal stories resulted in highly varied interpretations and iterations of work.
Sample Student Work


Maria Pelletier
Volume D: Dreams
Process
- Acquire sets of old encyclopedias. Students select a volume that resonates with them. Have them flip through the subjects covered in that volume.
- Ask them to share then discuss why that volume resonates with them and verbalize issues that matter to them.
- Brainstorming – students share what the book might become to impart a social justice message. This allows others to offer ideas and potential manipulations of how the book might be reimagined. This should begin to unlock individual ideas and motivate the students. Can include a discussion of artist voice and what it can be.
- Personal stories or concerns are the swiftest path to artist voice.
- Make, write artist statement, share, and critique.
Conclusion Transformed Book Project – Critique and Discussion
Ask students about their reimagining of the encyclopaedia, tell their story, and explain their artist statement and comment on the transition from book to art object. Invite discussion on what viewers might see. Invite discussion on social justice issues as they apply to the transformed books. Students learned to define and refine their personal artist voice through the creation of an object. This social comment was practiced and shared. The project should provide the empowering groundwork to enable the students to bridge the more difficult second project using Big Data.
Learning Objectives
To create two art visualities which use both hand skills and 21st century skills to empower individual students to visually voice and communicate their own social justice concerns.
Art teachers need practical ways to solve the concerning curricular dilemma of incorporating 21st century learning into the art classroom. How do we encourage critical, analytical and creative thinking? How do we foster the interdisciplinary collaboration and teamwork needed to effectively communicate knowledge in a world increasingly dominated by digital technology? This will describe two projects undertaken by my preservice secondary art students. In the Book Transformation project, they transformed discarded encyclopaedias into multi-media art pieces. The students’ art addressed their lived experience, their personal concerns and their value judgments on matters of social, political or ecological importance. In the Big Data project, they tackled the problem of making sense of the sheer mass of data produced daily by and within global computer networks at a pace that far exceeds the organizational capacity of current databases and software programs. The traditional models of charts and graphs fall far short of imparting real meaning to those vast, abstract numbers. The students were asked to make the data meaningful on a relatable, human scale. They incorporated real-time information into a visual image, a physical object, or both. Completing these two projects empowered the students to think through ways to incorporate 21st century learning skills into their own teaching praxis. Notably this process may be introduced into any art education class or interdisciplinary collaboration with art to make sense of Big Data numbers and address the students’ social, political and ecological issues and concerns.
Central Questions – Teacher and student may address any or all of these
For maximum creativity, keep as open as possible to follow the students’ questions, concerns and artist voice.
- How can art make sense of Big Data numbers? How do we make incomprehensible data visible?
- How do we create visualities on a human scale that will move the viewer? A call to action?
- How do you use a dataset to create a visualization that resonates? Where the abstract idea becomes the concrete representation?
- How do we use art as the interpreter? Create and generate meaning in socially-engaged artworks? Art that moves the spectator to relate to the expressed concerns?
- How can we combine students’ art and hand skills with the computer on social issues that concern them?
- What’s their concern? How do they express it? “It is driven by their art.”
- How do you give students a voice?
- How can you teach your students to move other people to listen?
Learning Outcomes
This two-part project demonstrates higher levels of thinking by creating two objects which address the students’ own social justice concerns in their own artist voice.
The first project uses hand skills to reimagine an object, such as an encyclopaedia or book, into an abstract representation of an idea. The concrete object incorporates the idea into a final object with an artist statement.
The second project incorporates either static Big Data or kinetic real-time Big Data (from the internet) into the creation of a visuality or object that addresses the students’ social justice concerns in their artist voice. It takes the incomprehensible digital information of Big Data (numbers, an abstract concept) and creates a concrete representation relatable on a human scale.
Project Part 2 – Big Data Visualities
Making sense of the numbers – more than just charts and graphs
The abstract digital information of Big Data may seem incomprehensible, but a concrete representation can make it relatable on a human scale. The second project builds on the students’ art skills, hand skills and their newly-practiced artist voice. It adds a computer screen and other media to create a visuality which explains the vast numbers in Big Data.
We collect data on everything. Data is the new oil – a valuable resource of information used everywhere, from improving our quality of life to selling us things we don’t need. Can we bring those vast numbers to a human level?
Sample Student Work


Andrew Swainson
Live Tweets
Learning Objectives
The project encompasses several concepts. Hand skills based on the principles and elements of design are incorporated into 21st century computer skills to express artist voice and create meaningful social, political, and ecological commentary through art visualizations. Students create the works then present them in the classroom. The visualities foster discussion and may have the potential to become class projects. In this way a large group project can develop out of the two projects listed in this paper.
Learning Outcomes
This unit challenges traditional, formalist modes of art education which emphasize media manipulation and craftsmanship. Instead, it favours concept development, risk, experimentation and collaboration while engaging with contemporary artistic practices. By addressing issues that might arise in public spaces, it deals with issues that are relevant to the everyday lives of student-artists. It is broken into roughly 3 segments: (a) thinking and brainstorming, (b) planning and strategizing, (c) making, reimagining, playing, implementing and documenting.
Teacher and student process:
- Use sample websites provided to introduce Big Data, how it is used and how it is abused. Have students discuss implications while sharing what they know about Big Data.
- Discuss problems of numbers being difficult to understand and brainstorm ways to visualize them to understand them on a personal level.
- Share the work of several professional artists who have created Big Data art – sample websites provided. Critique and discuss the processes they might have used.
- View and discuss websites with real time display of data counts, e.g. nohomophobes.com (see sample website references provided).
- Students choose websites which resonate with them, then brainstorm how to create an image or object which communicates social justice issues important to them. This is best generated by the students in their own voice.
- Have them do searches and design and create their ideas in a concrete object which communicates abstract Big Data information and ideas.
- Computers or digital devices may be incorporated into the work, kinetically showing counts from real-time Big Data collection or interpretations.
- Artist statement is written, work is presented and critiqued.
- If teacher wishes the project to continue, have students select one or two of the most resonant projects and create a collaborative piece which may be presented to the school to initiate school discussion on the selected social justice issue.
- Lesson pacing is student and teacher specific because it is best if the creative process is driven by the students’ passion and stories.
Students will use art hand skills to bridge 21st century skills of learning and the digital screen in a way not accomplished by charts or graphs which are not memorable nor necessarily understandable. It is up to the students to:
- find the data which concerns them,
- brainstorm how best to represent and communicate those concerns in a visuality,
- solve how to animate or incorporate a kinetic real-time counter of the Big Data being collected.
PowerPoint examples of my students’ work which projected a powerful artist voice:
- “What does a number mean?” A student created a large, static hand-drawn tally sheet to understand the 1 in 5 persons who consider, attempt, or succeed at suicide. She created this work as a result of the trauma she experienced when two close friends committed suicide. Made of Mylar, the 4’ x 3’ sheet contained numerous small rows of tally marks. Four were black and the 5th tally in red ink represented a suicide. She covered the sheet with several thousand sets. Each room she goes into she wonders who that fifth person might be.
- Their images imparted ways to understand the huge numbers created by live feeds. One student illustrated the speed of deforestation and waste. She combined an internet digital real-time Big Data display of disappearing forests with a tree hung with 50 rolls of toilet paper – the number of rolls we manufacture each second. Each tissue square represented 100,000 tons of paper production.
- A student turned the production of CO2 emissions per second into a real-time animation of elephants expelled from a chimney. They remained floating in and filling the air.
Presentation / Critique / Reflection
After the creation of the transformed book and later the Big Data visualities, students will present the work as a discussion of the Big Data numbers – likely included in real time in the work itself, and the issues that led them to their concerns, and group discussion on impact and success of the work created. This documents their actions to the rest of the class in a large group critique, sharing anecdotes, interpreting the actions, discussing the spectator’s response, and evaluating the outcome. To conclude the unit, students will complete a written response evaluating their own work and connecting it back to the discussions that inspired their work. Their artist voice becomes obvious through the critique and the work itself.
Big Data as a Visuality Art Movement
Datifying the world
Big Data refers to the sheer mass of data produced daily by and within global computer networks at a pace that far exceeds the capacity of current databases and software programs to organize. Big Data describes the idea that everything can be digitized and “datified” thanks to cheaper storage, faster processing and more complex algorithms. Then, it may be coded to extract datasets which would not have been imaginable even a decade ago.
Humans are an endless source of data as are our planetary ecological sensors. The numbers are large and sometimes impossible to comprehend, but artists can take that data and create visualities as installations or images to interpret that data and return it to a human scale. The raw language of data needs to be translated into a universal language like art, which might be felt more deeply. Perhaps we can teach how to use art to prod us to ask questions leading to social change, or to give reasons for individual change. It is art for social commentary at its finest.
Digital media artist and entrepreneur Aaron Koblin said, “Artists work with real-world data, information that’s recognizable to all of us but tells a story that we may not have seen before or gives us a different perspective on the world around us. At its best, data art tells the viewer something new about our culture, how we live our lives, and how we see the world. New types of creativity are waiting to be uncovered by anyone who takes this new technology and uses it to re-think old rules.” (Smolan, R & Erwitt, J, 2012). In this digital age, we can marry the new data technologies with old world hands-on art making. The key contribution young artists can make is in helping to create meaning and poetry from these vast data fields to promote understanding and social change.
To become a data artist, all you need is a little bit of practical knowledge and a whole heap of imagination. Look around you: What data is available? Try representing it, somehow, any way you can, even if it’s with pencil and paper.
Teacher Overview / Rationale
Today’s students have grown up in the digital world. They have spent their entire lives steeped in a technology that did not exist a generation ago. Students who grow up at ‘twitch speed’ rely on ‘quick looking.’ What loses are at play? What gap is there between the ocular and haptic learning?
In attempting to bridge a gap between artist and viewer while also challenging the elitism and preciousness associated with art, artists have long sought ways to blend the art experience into the everyday. From the ephemeral performances and “social sculptures” of 20th century conceptual art to the culture-jamming interventions of contemporary street art, there is a rich historical context for engaging directly with the spectator in public spaces. Taking artwork into public spaces in the form of actions rather than objects – actions which involve the participation of the spectator – bypasses the negotiations and mediations that take place when a viewer experiences something presented as “art” and opens generative (and unexpected) spaces of dialog and meaning-making
Teacher and Student Resources – Understanding Big Data
Websites
Smolan, Rick, and Jennifer Erwitt. The Human Face of Big Data. Sausalito: Against All Odds, 2012. Print.
http://www.bbc.com/news/technology-21535739
also available as an iPad app from https://itunes.apple.com/ca/app/human-face-big-data-tablet/id579041860?mt=8
The Obelisk (2012) is a kinetic sculpture about genocide by Fabio Lattanzi Antinori
http://vk.com/wall-40000548?offset=360&own=1&z=video171097386_164159449%2F606da3f564413f6ac1
Using Big Data to combat crime
http://www.bbc.com/news/technology-22008497
Citizen science using gaming to map the brain
http://blog.eyewire.org/about/
https://plus.google.com/photos/+EyewireOrg/albums/5862119614724765073
The World's Facebook Relationships Visualized
http://mashable.com/2010/12/13/facebook-members-visualization/
Google Books Ngram Viewer
https://books.google.com/ngrams
Examples of digital media art
http://www.aaronkoblin.com/work.html
http://nicolatriscott.org/2012/09/23/art-in-the-age-of-big-data/
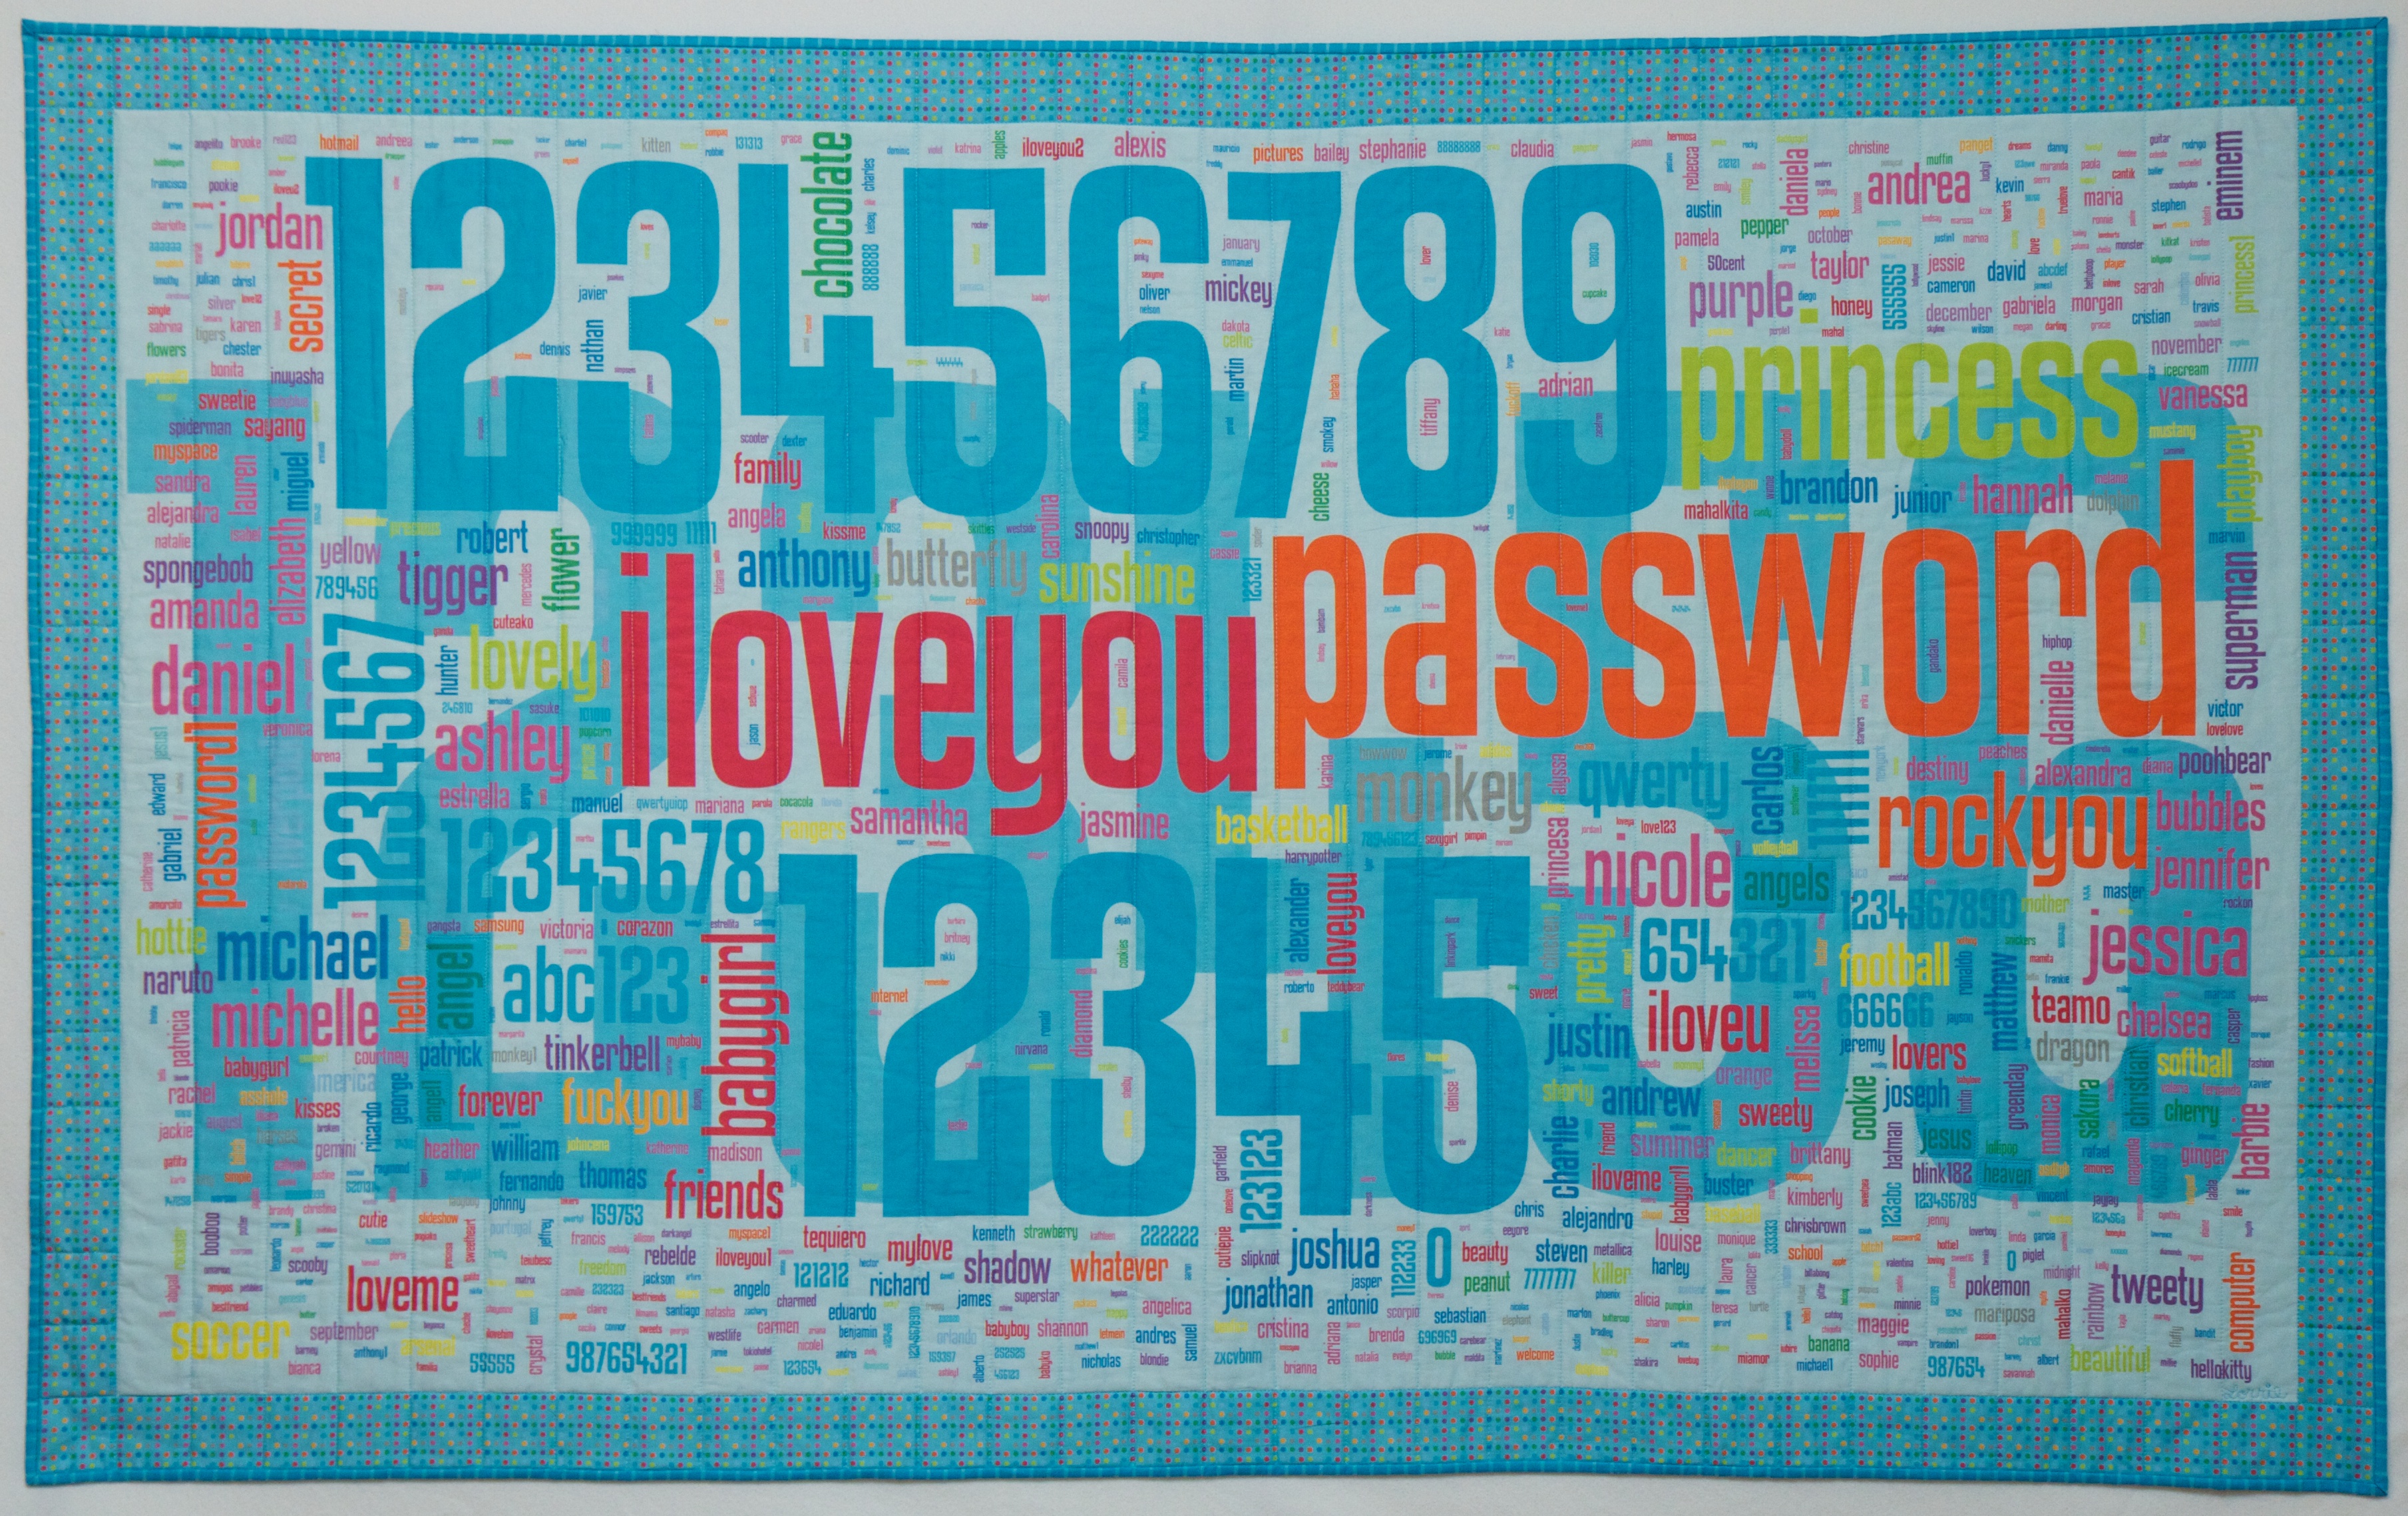
http://lorrie.cranor.org/quilts/passwords.jpg
http://www.gregadunn.com/gold-leaf-painting-by-greg-dunn/cortex-in-metallic-pastels/
http://www.nsf.gov/news/special_reports/scivis/popup/humanhand.jsp
http://www.reconnoitre.net/bas/
Examples of post-modern artists using data art
Chris Jordan – Eco artist/photographer
Creating with Camera and Photoshop – A process for visualizing numbers
Artist Chris Jordan has taken everyday objects and statistics from Big Data and used Photoshop to create powerful visual images. Watch this video to put this art–number–data into context. This is an option for some of you who are comfortable with the computer.
https://www.youtube.com/watch?v=28KSLMSGncs
His website has imagery which zooms in on each – have a look at these visual images which describe data. The images are meant to give some meaning to the numbers – and most are disturbing.
http://www.chrisjordan.com/gallery/rtn/#prison-uniforms-set
http://www.chrisjordan.com/gallery/rtn2/#maya
http://www.chrisjordan.com/gallery/rtn/#barbie-dolls
http://www.chrisjordan.com/gallery/rtn/#silent-spring
Fabio Lattanzi Antinori
http://www.fabiolattanziantinori.com/oracle.php
http://www.fabiolattanziantinori.com/thefoursisters.ph
Nathalie Miebach
http://nathaliemiebach.com/sketch.html
The drawings (plans) are like an illustration an architect or engineer might use to present an idea to a client. She makes kinetic sculptures.
Paul Cummins and Tom Piper
Making sense of numbers
WWI Poppy Project – Blood Swept Lands and Seas of Blood
https://poppies.hrp.org.uk/about-the-installation
Magicalurbanism.com has an astonishing range of work done to illustrate social questions. A few have a Big Data leaning and all are intriguing examples of the postmodern art which we have been touching on. But if you scratch the surface and look at the artists, a surprising number of them are classically-trained in drawing, painting, sculpture and design. Their work is rooted in these skills.
http://www.magicalurbanism.com/archive
The fun theory project – kinetic art for social change
Piano stairs
https://www.youtube.com/watch?v=2lXh2n0aPyw
Student Data Source Website Samples
http://www.internetlivestats.com/one-second/
http://www.theworldcounts.com/
http://www.statisticbrain.com/christmas-tree-statistics/
http://www.statisticbrain.com/geographic/
Tweets
http://www.internetlivestats.com/one-second/
Toilet paper rolls
http://www.theworldcounts.com/stories/Paper-Waste-Facts
Environmental degradation
http://www.theworldcounts.com/counters/degradation_and_destruction_of_ecosystems/why_is_deforestation_a_problem
CO2 emissions
http://www.wri.org/publication/world-greenhouse-gas-emissions-2005
Kinetic social justice website – LGBT
Big Data Visuality Project Activity discussion prompts
- Discuss the impact of Big Data on our way of life and the policies which emerge publically and privately as a result of data collected around the world.
- Some thoughts on solving the problem of creating a visuality. One of the large issues with describing some statistic or relationship which might be mined from Big Data is that the numbers become almost impossible to comprehend as they tend to be so large.
- Art may be used as a visuality to represent or describe those numbers of an issue social, political, economic, geographic, ethnographic, sociological, scientific, ontological, power relationship, health relationship, consumption statistic, etc.
- How would students describe their artist voice before and after these projects?
Problematics of Big Data – Size
http://nicolatriscott.org/2012/09/23/art-in-the-age-of-big-data/
- The challenges of managing Big Data are huge, and developers need to be able to play with data,
- so it must be freely available to everyone to use and republish as they wish, without restrictions from copyright, patents or other controls,
- “open data” is rapidly gaining support, particularly in areas such as science and government and requires new tools to make sense of large data arrays,
- citizen science and crowd source data collection may become a new means of interpreting scientific data.
Problematics
Mario Carpo, a Yale art history professor, said, “Data analysis is a new kind of agnostic science that can make effective predictions without any understanding of the reasons, laws, patterns, or principles we used to need to make sense of the world.” (Smolan, R & Erwitt, J, 2012)
- For data mining one need only begin with an idea followed by a construct, and then an algorithm to plug into the data source. This means that any dataset can be used nearly a limitless number of times and for any purpose an algorithm designer can think up.
- Worse, is there an algorithm to watch over the algorithms?
- What about mistakes that take on a life of their own? Today, digital media, even at its most elemental level, is always about selection. One is never creating anew but manipulating signals and data, and potentially being able to remanipulate it infinitely.
- Our desire to observe the universe has created a landscape in which facts are numerous, indiscriminate, are becoming infinite and in many cases, trivial. In the flattened vast datasets, a single value summarizing the life’s work of a research scientist is indistinguishable from the random, constant internet chatter logged every millisecond.
Ethical Concerns
In an article in Forbes, What’s Up With Big Data Ethics? by Jonathan H. King & Neil M. Richards (2014) they write that the Big Data revolution raises many ethical issues related to privacy, confidentiality, transparency and identity. "In the future, everything will share data – our heartbeats will be recordable; everyday appliances like cars and refrigerators will stream data online; if a device processes information of any kind, it will soon have the ability to share it."
- Who owns all that data that you’re analysing? Are there limits to what kinds of inferences you can make or what decisions can be made about people based on those inferences?
- The problem is that our ability to reveal patterns and new knowledge from previously unexamined troves of data is moving faster than our current legal and ethical guidelines can manage.
- We’ve driven off the existing ethical and legal maps.
- If we fail to preserve the values we care about in our new digital society, then our Big Data capabilities risk abandoning these values for the sake of innovation and expediency.
http://www.forbes.com/sites/oreillymedia/2014/03/28/whats-up-with-big-data-ethics/
Conclusion
Art offers a way of enhancing our increasingly-flat world for:
- social commentary,
- student voice and concerns over the use of computers and data collection which affects all of us,
- a way to make the art curriculum relevant in every subject discipline,
- interpretation,
- a call to action, and
- citizen science.
Student artists must find their own voice through expressing the issues which concern them personally. It becomes the ‘engine’ of energy which drives them to excel in their image creation.
At its best, data art tells the viewer something new about our culture, how we live our lives, and how we see the world. New types of creativity are waiting to be uncovered by anyone who takes this new technology and uses it to re-think old rules.
There is a critical role for artists in creating new systems of data representation, visualisation, personification, and simulation across fields ranging from astronomy, geology, nanoscience, sound mapping and medicine, to business and finance.
Evaluation
For highest level of student work and thinking, make sure that they are working with issues that matter to them. Do not share too many external ideas, or they will be more likely to replicate models of searched ideas, rather than their own. Provide rubrics (if needed) at the end of the project for maximum creative results and artist voice.
Vocabulary
21st century learning, algorithm, art education, art hand skills, artist voice, Big Data, citizen science, critical thinking, critique, crowd source data, curriculum, data artist, data coding, data mining, dataset, datify, digital media art, interdisciplinary, kinetic, open data, social justice, socially-engaged art, static, visuality